Mastering Crypto Trading Pattern Analysis: Beyond the Charts in 2026
Master crypto trading pattern analysis for 2026. Learn why charts fail and how to use your own data to find a real edge and improve your trading success.
June 21, 2026 · 15 min read
Mastering Crypto Trading Pattern Analysis: Beyond the Charts in 2026
The most dangerous lie in crypto is that a perfect chart pattern guarantees a winning trade. You've seen it happen. You identify a flawless breakout, the technicals align, and yet the trade still ends in a frustrating loss. Even a sophisticated crypto trading pattern analysis can fail when the market is gripped by extreme fear, as we're seeing with the current Fear & Greed index sitting at 20.
It's exhausting to feel like you're doing everything right while your account balance says otherwise. You deserve a strategy that accounts for more than just lines on a screen. We're going to bridge that gap by merging market geometry with the one variable most traders ignore: their own performance data. This is how you move from confusion to a position of modern confidence.
This guide provides a clear framework for high-probability patterns and a practical method to audit your personal execution habits. You'll discover how to turn your historical data into a high-performance instrument that reduces drawdown and uncovers your true competitive advantage. It's time to find your edge beyond the charts and master the mechanics of your own success.
Key Takeaways
- Learn why 2026 crypto markets require a dual approach that tracks both recurring price formations and your own execution behaviors.
- Identify high-probability setups like Wedges and Channels while recognizing the specific indicators of "Inverse Head and Shoulders" patterns in Bitcoin cycles.
- Discover why the "perfect setup" often fails and how a professional crypto trading pattern analysis reveals the hidden execution errors holding you back.
- Build a data-driven framework by aggregating your trade history via API to categorize strategies like breakouts versus mean reversion.
- Eliminate manual journaling and use a Trading Health Score to gain an objective, automated view of your performance consistency.
Table of Contents
Defining Crypto Trading Pattern Analysis in 2026
The definition of success in digital assets has shifted. It is no longer enough to simply spot a flag or a wedge. In the current market, effective crypto trading pattern analysis is a systematic study of two distinct data sets: recurring price formations on the ticker and recurring execution behaviors in your account history. With Bitcoin trading around $63,000 and the Fear & Greed Index hitting "Extreme Fear" levels of 20, the margin for error is razor-thin. You need a strategy that accounts for the speed of 24/7 liquidity and the brutal reality of high volatility.
Traditional Technical Analysis Principles provide a foundation for understanding market psychology. They help you read the collective sentiment of the crowd. But in a high-performance environment, drawing lines on a screen is just the entry price. Mastery requires a deeper layer of intelligence. It requires connecting the external movements of the market to your internal performance metrics. This dual-lens approach is what defines a professional in 2026.
External vs. Internal Pattern Recognition
External patterns are the formations everyone sees. These include head-and-shoulders, ascending triangles, and bull flags. They represent the market's breath. Internal patterns are different. These are your personal habits, such as a tendency to revenge trade after a drawdown or the habit of exiting a winning position too early. Understanding your crypto trading pattern analysis means recognizing how these two worlds collide. For example, you might find that your Trading Health Score is exceptional during breakout trades but collapses during mean reversion. This insight allows you to stop fighting the market and start playing to your documented strengths.
The Role of Data Clarity in 2026
Guessing your edge is a guaranteed path to liquidation. The 2026 market is too efficient for "gut feelings" or manual spreadsheets. We have transitioned from manual journaling to sophisticated, automated analytics. By leveraging detailed Account Performance Reports, you can transform raw trade history into a clear strategy map. This removes the friction of uncertainty. Instead of wondering why a "perfect" setup failed, you can analyze your execution timing and slippage. Actionable intelligence is about turning data into discipline. It is about moving beyond the charts to understand the mechanics of your own profitability.
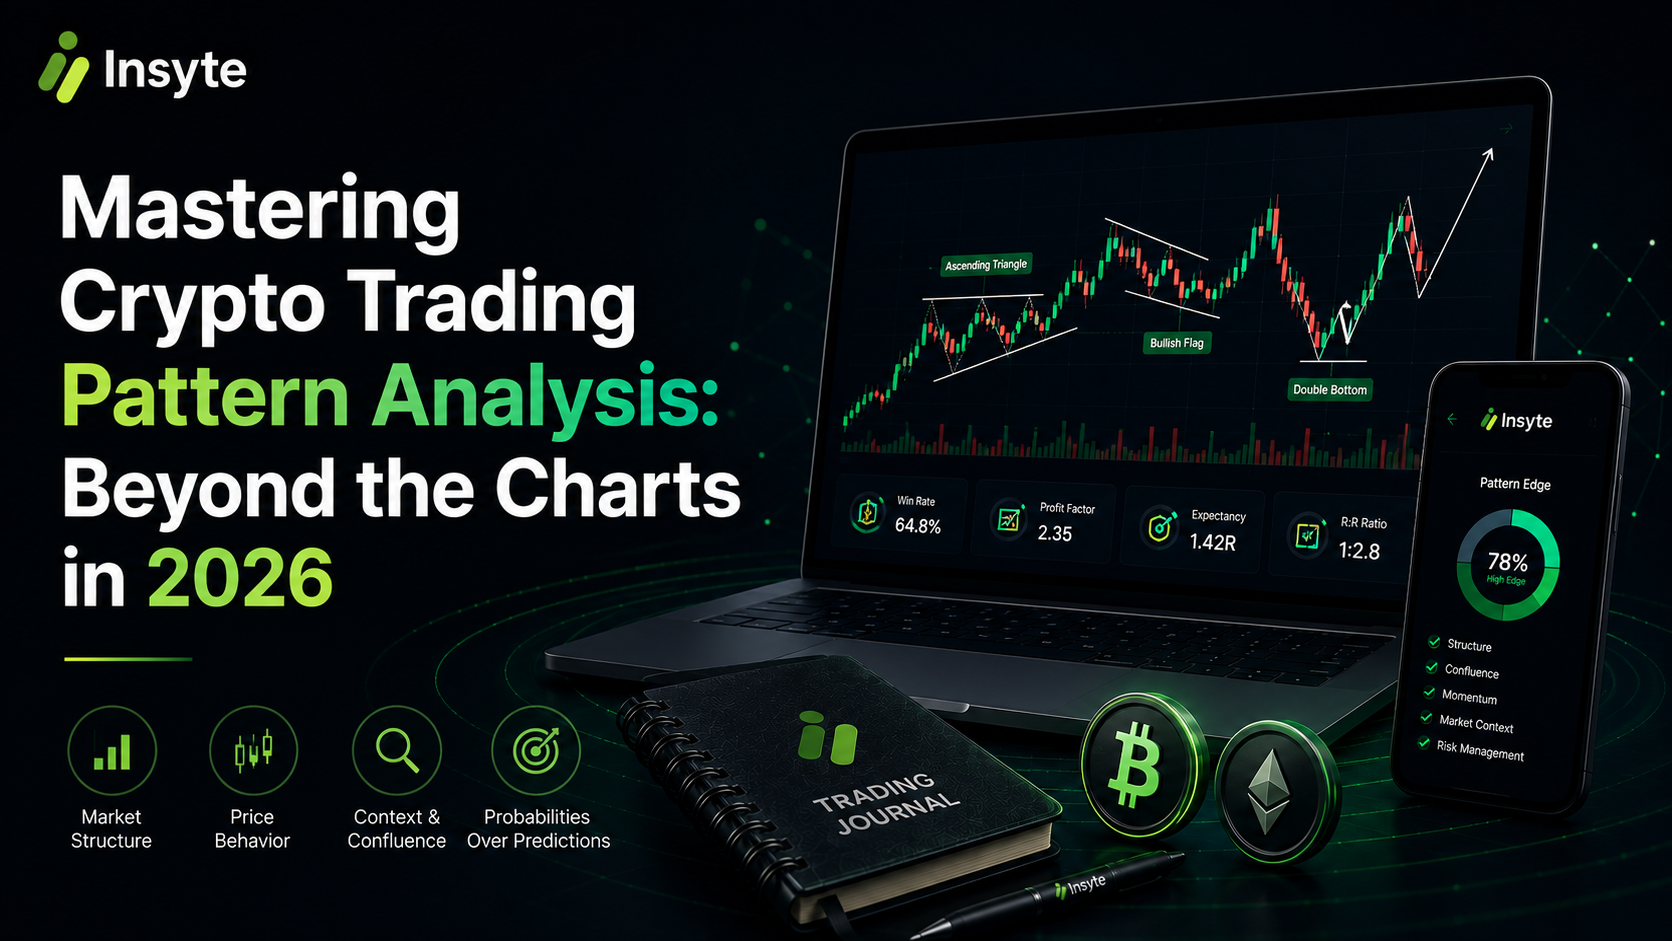
Essential Crypto Chart Patterns for Market Analysis
Success in 2026 isn't about memorizing fifty different shapes. It's about mastering the high-probability setups that actually deliver results. In a market currently dominated by Bitcoin and Ethereum, focusing on Triangles, Wedges, and Channels provides the most reliable foundation for your crypto trading pattern analysis. These formations represent the consolidation of price before a decisive move. However, a pattern is only half of the story. You must seek volume validation. A breakout on thin volume is often just a liquidity trap designed to catch late buyers. Look for a surge in trading activity to confirm that the market has real conviction behind the move.
Reversal patterns are particularly vital during the current Bitcoin cycles. The "Inverse Head and Shoulders" has recently appeared as a powerful signal for local bottoms when BTC stabilizes around the $63,000 mark. Conversely, in a trending market, continuation patterns like Bull Flags allow you to time entries without chasing the initial pump. To see how these setups impact your bottom line, use a Ticker Analyzer to track which specific formations lead to your most consistent wins.
Reliability Rankings for Top 5 Formations
Not all patterns are created equal in 2026. Double Bottoms are currently showing high success rates on major assets like ETH and BTC due to the majors-led nature of the market. Pennants, while popular, often fail in low-liquidity altcoins right now. This is because the Altcoin Season Index is sitting at a modest 45, suggesting speculative fervor is low. Timeframes also dictate reliability. A pattern on a 1-day chart carries significantly more weight than one on a 1-hour chart, which is often cluttered with leverage-driven noise and liquidations.
Confluence: Combining Patterns with Indicators
Never trade a pattern in isolation. Use confluence to build a stronger case for every position. RSI divergence is a premier tool for confirming pattern reversals; if price makes a lower low but the RSI makes a higher low, the pattern has legs. Moving Averages serve as dynamic support and resistance within price channels, providing precise areas to set your stop losses. Finally, apply Fibonacci retracement levels to check pattern depth. A flag that retraces beyond the 0.618 level is often a sign of weakness rather than a healthy pause. This multi-layered approach ensures your crypto trading pattern analysis is rooted in data, not just hope.
The Performance Gap: Why Chart Patterns Aren’t Enough
Identifying a textbook head-and-shoulders is easy. Executing it flawlessly is where most traders fail. The "Perfect Setup" Fallacy suggests that if the chart looks right, the profit is guaranteed. This is a dangerous misconception. In reality, your crypto trading pattern analysis is incomplete if it ignores the friction between the chart and your mouse click. Execution errors can turn a high-probability win into a frustrating loss before you even realize what happened.
Consider the common leaks that drain accounts every day:
Slippage: Entering with market orders during high volatility, losing 1-2% of the move instantly.
Late Entries: Waiting for too much confirmation and entering at the peak of the candle.
Fat-Finger Mistakes: Miscalculating position size or hitting the wrong button under pressure.
Your psychology acts as a filter. When the market is in "Extreme Fear," you might see reversal patterns that don't exist. Or worse, you ignore valid breakouts because you're paralyzed by the recent price action. This gap between observation and action is why a trader with a 70% win rate can still have a negative profit factor. It's not the market's fault. It's a performance bottleneck that requires a sophisticated solution.
Analyzing Your Personal Execution Patterns
Stop blaming "whales" for your drawdowns. Start looking at your internal data. Are you consistently entering late on breakouts? If you're chasing the pump, you're shrinking your reward and expanding your risk. Tracking the delta between your "Planned Exit" and "Actual Exit" reveals the true cost of hesitation. You might discover that your "Red Days" aren't random. They often follow specific behavioral triggers. By reviewing your history, you can pinpoint exactly where your execution deviates from your plan.
The Hidden Cost of Direction Bias
Objectivity is the trader's greatest asset. Many participants fall into the "Permabull" trap. They only look for long setups even when the trend has clearly flipped bearish. This bias blinds you to valid reversal patterns and makes you ignore the warning signs on the ticker. By analyzing your success rate on long versus short trades, you can identify if you have a structural weakness in one direction. High-performance traders use data to remain neutral. They don't care which way the market goes; they only care about following the documented edge. This transition from bias to data-driven clarity is what separates the masters from the amateurs.
How to Conduct a Professional Account Pattern Analysis
Stop looking at the market for a moment. Look at yourself. A professional crypto trading pattern analysis is incomplete without a deep audit of your own execution data. This is where you move from guessing to knowing. By shifting your focus from what the market might do to what you actually did, you gain a level of clarity that most traders never achieve. It's about refinement. It's about removing the friction between your strategy and your results.
To begin, you need a streamlined process for data collection. Follow these steps to build your strategy map:
Step 1: Aggregate your trade history via API. Manual spreadsheets are slow and prone to "fat-finger" errors. Automation ensures total visibility.
Step 2: Categorize every trade by setup type. Distinguish between "Breakouts," "Mean Reversions," and "Trend Following."
Step 3: Analyze your hold times. Are you cutting your winners short out of fear or letting losers run out of hope?
Step 4: Review your Trading Health Score across different sessions. Identify if you perform better during high-volatility US hours or steadier Asian sessions.
Step 5: Identify your Ticker Edge. Your data will show you exactly which assets respond best to your personal style.
Once you've aggregated this data, you can stop fighting the market and start playing to your documented strengths. Ready to see your own data clearly? Start your Account Pattern Analysis today to uncover your true trading edge.
Hold Time Analysis for Profit Optimization
Finding your "Sweet Spot" is the fastest way to increase your profit factor. By correlating your hold time with your win rate, you'll see a clear window where your setups are most effective. If your win rate collapses after two hours, you're likely "Bag Holding" in a failed pattern setup rather than exiting at your planned stop. The duration of a trade must align with its volatility profile to maximize the profit-to-risk ratio. Efficiency is key; don't let a winning scalp turn into a losing swing trade because you missed the exit window.
Ticker Analyzer: Finding Your Asset Edge
You don't need to trade everything. In the current market, you might be a professional at trading SOL but a complete novice at BTC. This isn't random. Different assets have different liquidity profiles and volatility signatures. Use a Ticker Analyzer to filter your performance by asset class. If your data shows a consistent edge in high-beta altcoins but a negative return on Bitcoin, stop trading Bitcoin. Focus your capital where the data proves you have the highest probability of success. Mastery is about concentration, not diversification.
Elevate Your Edge with Insyte’s Automated Analytics
Manual journaling is a relic of the past. It's slow. It's prone to error. You've spent hours drawing lines for your crypto trading pattern analysis, but if your records are a messy spreadsheet, you're flying blind. Insyte changes the game. It syncs directly with your Binance, Bybit, or Coinbase history. This provides total visibility without the friction of manual entry. You get a streamlined view of your progress that updates as you trade.
Your performance isn't just about your PnL. It's about consistency. Our Trading Health Score provides an objective look at your execution quality. It reflects your true discipline. It tells you if you're actually following your strategy or just getting lucky in a majors-led market where Bitcoin remains the dominant force. This score removes the emotional fog of a winning or losing streak. It keeps you focused on the metrics that lead to long-term growth.
We all have them. Silent habits that kill win rates. Maybe it's a tendency to overtrade after a BTC price surge or a habit of widening stops on Ethereum. Our Account Pattern Analysis shines a light on these behaviors. It turns the "why" of your losses into actionable intelligence. You get professional-grade Account Performance Reports that turn confusion into clarity. No more guessing. Just data-driven refinement.
Automated Insight vs. Manual Guesswork
Insyte clarifies the narrative of your trading career. Every win and loss has a story. We help you read it. You get real-time feedback loops that sharpen your execution strategy immediately. Seeing your progress through data-driven visuals is satisfying. It builds modern confidence. You stop wondering and start optimizing. This is the transition from being a participant to being a master of your own data. Our Ticker Analyzer and automated tools ensure that your focus remains on high-performance execution.
Ready to Master Your Patterns?
The path from confusion to understanding is now automated. You've learned how to read the market and how to audit your account. Now, let the technology do the heavy lifting. Join a community of serious traders who value their time and their results. It's time to refine your craft with the best tools available. Take the first step toward a true trading edge.
Get Started with Insyte for Free
Own Your Execution Strategy
The era of relying solely on visual chart formations is over. Achieving a consistent edge in 2026 requires a deeper integration of market geometry and personal execution data. You've seen how external setups like wedges and triangles only tell half the story. The other half is hidden within your own habits. By conducting a professional crypto trading pattern analysis, you bridge the gap between spotting a setup and realizing a profit.
Clarity comes from automation. Stop fighting manual spreadsheets and start leveraging intelligence that works at the speed of the market. With an Automated Trading Journal and Real-time Account Performance Reports, your strengths and weaknesses become impossible to ignore. You gain the satisfaction of refinement. You see your Trading Health Score climb as you eliminate the behavioral leaks that once drained your capital.
Refinement is a journey, not a destination. It's time to trade with the calm assurance that comes from documented proof. You have the tools to move from confusion to understanding.
Sharpen your strategy with Insyte’s automated pattern analysis.
Frequently Asked Questions
Is crypto trading pattern analysis actually reliable?
Yes, it's a reliable method for tracking the footprint of human emotion and institutional liquidity in the market. However, it only reaches its full potential when you validate market setups with your own performance data. A professional crypto trading pattern analysis isn't just about the chart; it's about how you execute those specific setups under pressure.
What is the most successful chart pattern in crypto?
High-probability setups like Wedges and Channels currently show the most consistency in majors-led markets. During the 2026 Bitcoin cycles, the Inverse Head and Shoulders has also been a standout for identifying local bottoms. Reliability usually increases on the 1-day timeframe compared to lower-period charts where leverage-driven noise is more common.
How can I analyze my own trading patterns automatically?
You can automate this process by using an Automated Trading Journal that syncs directly with your exchange. This removes the friction of manual entry and prevents common "fat-finger" errors. It allows you to focus solely on the actionable intelligence provided by your data rather than the tedious chore of recording every trade by hand.
Can I use pattern analysis for day trading and swing trading?
Patterns are fractal and appear across all timeframes. You can apply these principles to 15-minute scalps or 1-week position trades. The key difference is the noise level; lower timeframes require much tighter execution and faster reactions, while swing trading demands the patience to wait for higher-conviction breakouts on daily charts.
What is a Trading Health Score and why do I need one?
This is an objective metric that measures your execution consistency and discipline over time. It helps you identify if your wins come from a repeatable strategy or just random luck. You need one to strip away emotional bias and see the objective truth of your performance, allowing for faster refinement of your edge.
How do I identify my "trading edge" in a bear market?
Identify your edge by filtering Account Performance Reports for specific market conditions. You might find you excel at shorting mean reversions or buying specific liquidity sweeps during downtrends. Bear markets reward those who stop guessing and start following the specific assets and setups where they have a documented win rate.
Does Insyte support API imports from major crypto exchanges?
Yes, we provide full support for major exchanges including Binance, Bybit, and Coinbase. This ensures total visibility of your trade history without any manual input required. You get a streamlined connection that turns raw data into professional-grade intelligence in seconds, removing the friction from your performance audit.
Why do most traders fail even when they know chart patterns?
Most traders fail because of the "Performance Gap" between a good chart and bad execution. They ignore the impact of slippage, late entries, and their own recurring behavioral patterns. Knowing the chart is only half the battle; mastering your internal reaction to that chart is what creates a professional, profitable trader.
← Back to all posts